
Display Chart (Map)
Description
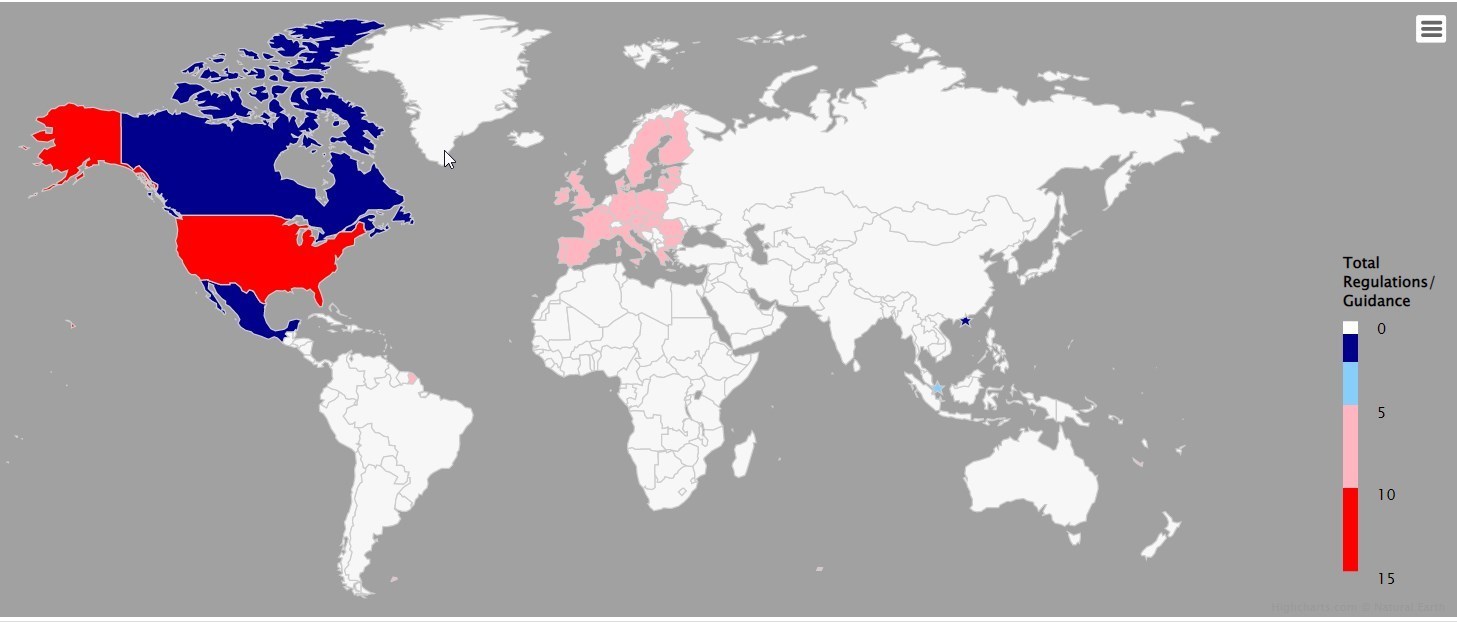
This article describes the steps to create a dynamic map on screen based on underlying data from your data model. The process of creating a map is a variation on using the Display Chart logicnet part. In addition to the steps below, there are references to the Highcharts.com online support that can potentially help you customize your map to the required specification.
The setup of a map, configuration of its look, and generation of dynamic data in the correct format are advanced steps in LogicNets. We recommend checking with your Account Manager to get some introductory help before embarking on the process.
Use
The Display Chart (Map) part is available in the Assessment and Starter App frameworks in the form parts node toolbox.
You are required to purchase a license from LogicNets to use the Highcharts plug-in, which includes a myriad of both charting and map designs.
Map Creation Process
Step 1: Choose the Map and Create the Display Configuration JSON
Highcharts offers several views of demonstration maps, and you can see the Additional Resources below for those sources. A good place to start is here.
We have found that a good tool to help with the overall process can be found at everviz.com, which is an offshoot business from Highcharts that offers various business tools under a subscription model and leverages the Highcharts Maps features. At time of writing, accounts at Everviz are free for limited use (design of 10 or fewer maps/charts), and at this third-party site you can do the following:
- load various map samples to begin to visualize your specific design
- load sample data from CSV files to see how your data will look
- customize the display configurations to achieve the desired look and feel (including chart title/placement, labels, colors, legends, tootips, etc.)
- copy the display configuration (in JSON format) in readiness for pasting into the logicnet Display Chart (Map) part
We recommend opening (a free) account at Everviz to use their configuration editors. Once you have a configuration that includes all your preferences, it is generally easier to edit them directly for final tweaks.
Step 2: Update the LogicNets Display Chart (Map) Form Part with the Display Configuration from Step 1
- Once you have finalized the chart configuration, copy the JSON-formatted information shown in the Preview and paste it into the LogicNets Display Chart part Display Configuration tab. Select JSON and paste into the config field.
- Of key importance is the JSON code that points to the JavaScript file you loaded into the Designer in Step 1.
 "chart": {
    "map": "custom/world"
  },
Note that you can include any sample data in the the configuration and you can remove it or leave it in place, as it does not interfere with the chart generation process during runtime.
Inspecting the JSON configuration file, you will see how the map has been configured with titles/placement etc. You can make minor changes, such as title text/placement, by directly editing the JSON file. Be careful though: the JSON is not syntax checked, so any changes to the file that break the structure will result in the map not displaying during runtime.
NOTE also that, as of time of writing, it is not possible to copy any edited JSON configuration FROM LogicNets BACK to Everviz.
- At the end of the display configuration, check the Map box.

Step 3: Find and Load the Map Definition
Highcharts.com offers a Maps Demo page where you can locate your chosen map from the list (A). Once you have identified the source map, download the JavaScript map definition from the link on the right (B), and load this file into the /resources/layout/js folder of your project.

Step 4: Generate the Data Required for the Map
We recommend using the data object configuration for maps, which requires the translation of your source data into the appropriate format and definitions required by the Display Chart (Map) part.
Note that organizing your data into the required structure quite often requires sophisticated logic and involves lookup tables, loops, and set data parts. It is therefore best done in its own logicnet, called just prior to the Display Chart (Map) part.

The "generate map data" logicnet will usually include the following:
- retrieval of source data from a table or the context into a collection
- setting up a loop (iterator) part to cycle through each record in the collection
- using set data object part to create an entry in a new collection called "data" that has one set of values for each cycle that consists of:
- the hc-key related to the map territory
[this can be inspected from the Javascript map definition. In future releases, we anticipate the Designer being able to associate data with any one of the map defined objects] - the numeric value from the source data associated with this territory
- the hc-key related to the map territory
- Note: in more advanced configurations it is possible to include information in another entry called "extra" and use that information in a custom tooltip
- writing the entire "data" collection into another collection as item 1
The Display Chart (Map) settings to support the map data structure are shown below.

Below is an example of the data set generated for a map of countries of the world with hc-key being the reference to the map, value being the numeric value assigned to that country, and extra being information that is presented in the tooltip. See the second screenshot for the result of this data for Belgium (Item #19: hc-key = "be".


Advanced Topics
User Selections with Maps
The Highcharts Maps themselves often have special features in place by default, including zoom, hover, and animations. It is possible to add user inputs overlaying or positioned to the side of the map that will cause the results of the "generate map data" logicnet to change, thereby giving the user an opportunity to see a filtered version of the map (e.g. excluding records from before a user-specified year, or excluding records of a specific type).
Highcharts Features
Within the Highcharts documentation and demo projects, various custom features are shown. While LogicNets cannot guarantee that these are all fully functional with the Highcharts plug-in, we would be delighted to help clients investigate how to incorporate specialized Highcharts Maps features.
Additional Resources
A list of useful resources relating to the Highcharts plug-in are here:
https://www.highcharts.com/demo/maps is a great place to start to see the variety of maps/features available
https://www.highcharts.com/demo/maps/all-maps is another showcase where you can choose which map and view it with various specialized features (after selecting your preferred geography, click on options on the left column to see - for example, a shaded map of the US with a pie chart for each state.
https://api.highcharts.com/highmaps/ shows all the HighCharts display configuration options
https://everviz.com/ is the 3rd-party web application that offers subscribers the ability to design and configure Highcharts and Maps with sample data sets.
Highcharts Maps has a forum here that provides questions from users and replies from the Highcharts Support Team. Many of these questions are answered with a JSFiddle demo that contain useful demonstrations of specific features that can be copied into the Display Configuration of the Display Chart (Map) part.
Example Project
An example project will be available here soon.
Limitations of LogicNets Implementation of Highcharts (Maps) Plug-in
The Highcharts (Maps) plug-in allows you to combine the power of the LogicNets interactive and dynamic data model with the visual display of charts and maps.
This does mean that JavaScript based examples freely available on the web are not immediately reproducible from within the LogicNets environment. Many examples contain JS functions that will not run when placed in the Display Configuration (JSON format, not JS). We do instead have the flexibility to manipulate the source data and labels within the runtime context and this can often be used to replicate a JS feature.
Please seek out your LogicNets Account Manager if you identify a Highcharts Map feature that you'd like to implement in your applications. We can help you figure out what's possible and how to do it within the confines of the LogicNets environment.
Reply
Content aside
- 3 yrs agoLast active
- 22Views
-
2
Following